|
|
Creating the Example Map |
|
|
|
|
Creating the Example Map |
|
|
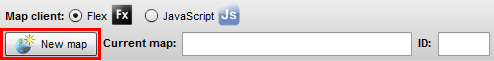
First, you create a new map in the atlasFX toolbar and name it "Trier Kindergartens".
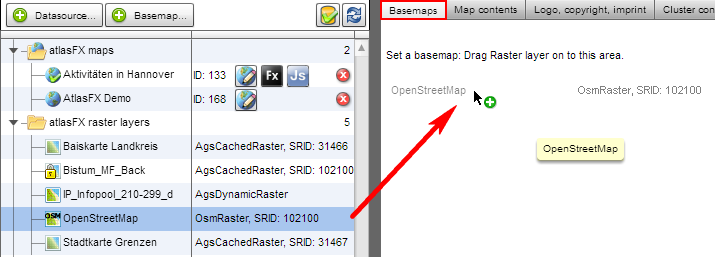
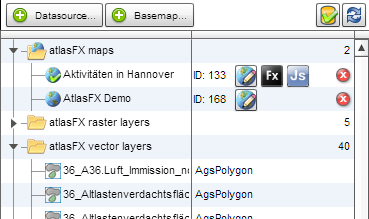
Now you have to set a basemap for your new map. For this example map you don't have to create a background cartography. Instead, you can use an OpenStreetMap basemap. Consequently, all scale levels are already preset and all map contents have to be prepared for the geographic coordinate system defined by the OpenStreetMap basemap. The OpenStreetMap basemap is available with the installation and can be found in the list of raster layers in the atlasFX browser. So you can simply drag and drop the OpenStreetMap raster layer into the area of the basemap.
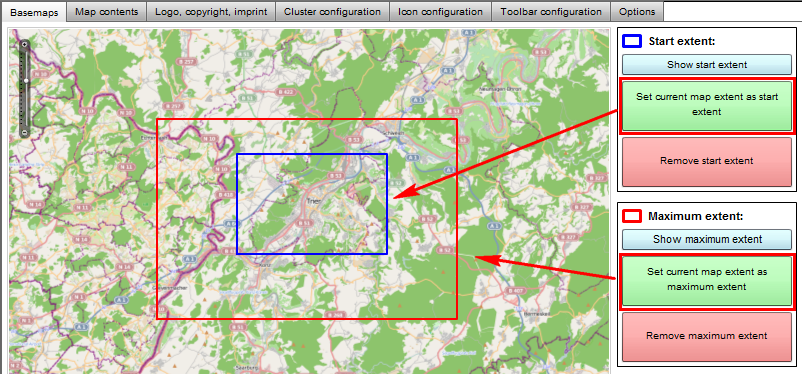
Because the map will contain the kindergartens in the district of Trier, you align the start extent with the district of Trier and as the start extent. Because point data is limited to the district of Trier, you also set the maximum extent for the map application around Trier and limit the scale range.
Information on additional configuration options for background maps can be found in Chapter Basemaps.
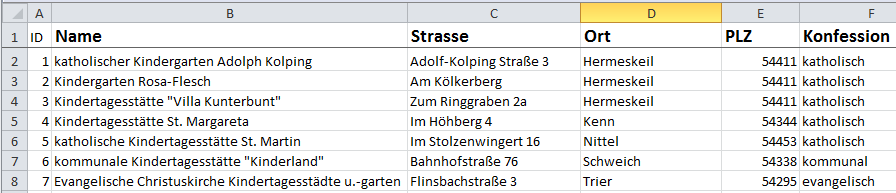
In this example, your data on the kindergartens in the district of Trier are available as an Excel table. The table contains information about the kindergartens, such as the names, addresses and the denomination.
You can add the Excel table through the Excel upload function.
In this case you choose "Excel file contains addresses" and assign the zip code, city and street name via drag and drop.

Then you press "upload" and a list of the geocoded addresses appears, where we can check if the localizations are correct.
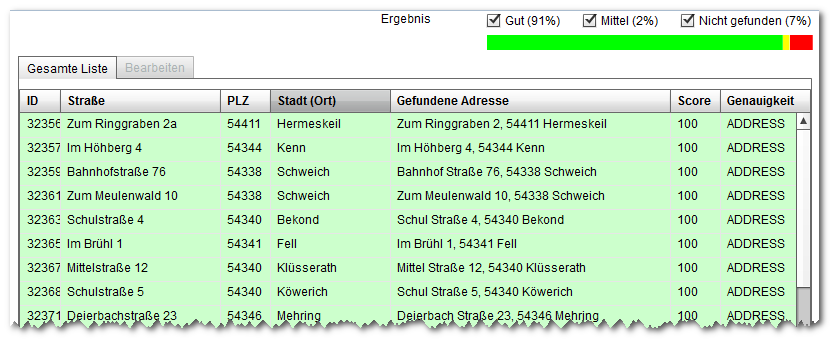
You now have the chance to manually correct the unresolved addresses with a location picker. For this example, we chose to ignore the unresolved addresses and press the save button  . Now the geocoded addresses appear in atlasFX browser as vector layers.
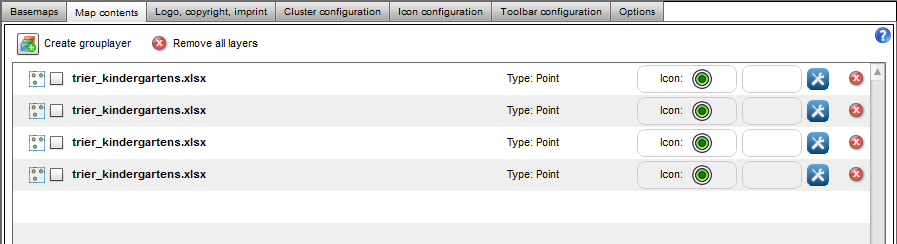
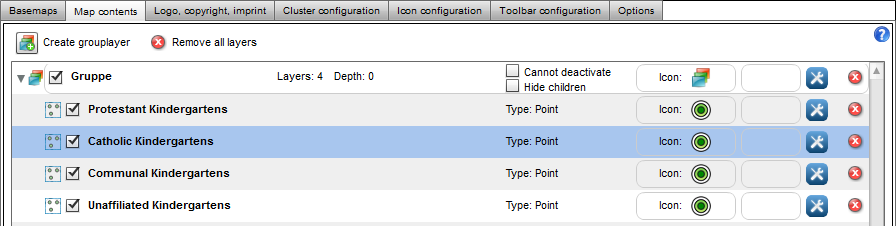
After you drag and dropped the kindergarten vector layer onto the map content tab of our map, you can customize it. The Excel spreadsheet from which the layer was created contained data about the denomination of the kindergartens. In order to presented the kindergartens according to their denomination, the data set must be split up. There are four different values given in the data sets for confession: protestant, catholic, unaffiliated, communal. Accordingly, you have to drag and drop the generated point layer four times into the map content area.
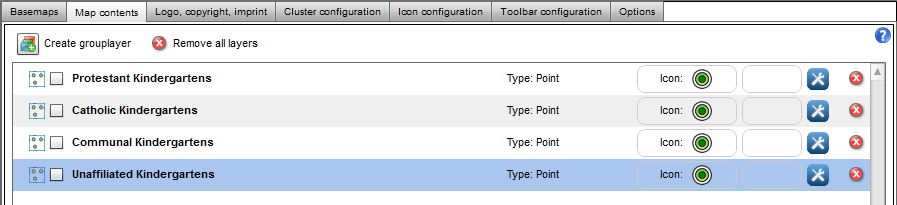
Now you can rename the layers according to the denomination they should represent. The layers can be renamed with a simple click on the layer name.
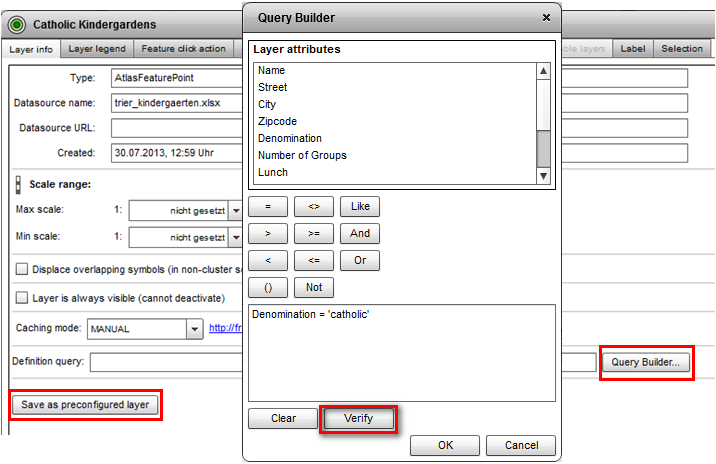
Each of these layers currently shows all of the kindergartens, regardless of the denomination. In order for each layer to display only one denomination, a data constraint has to be made for each layer. You can set this in the Layer Info tab in the advanced settings of the layer. The advanced settings can be edited in the layer info tab under advanced settings. Here you can make the data limitation with the SQL editor.For the catholic kindergarten you hence enter Denomination = 'catholic'. With a click on the button "verify" you can check if the syntax of your input is correct. If you want to use this layer with this data limitation more often, it would make sense to save the layer as a preconfigured layer. The layer with the data limitation will then show up in the atlasFX browser as vector layer.
Similarly, the other layers are edited with the corresponding data limitations.
Now you can create a group layer, to which you can add the kindergartens.
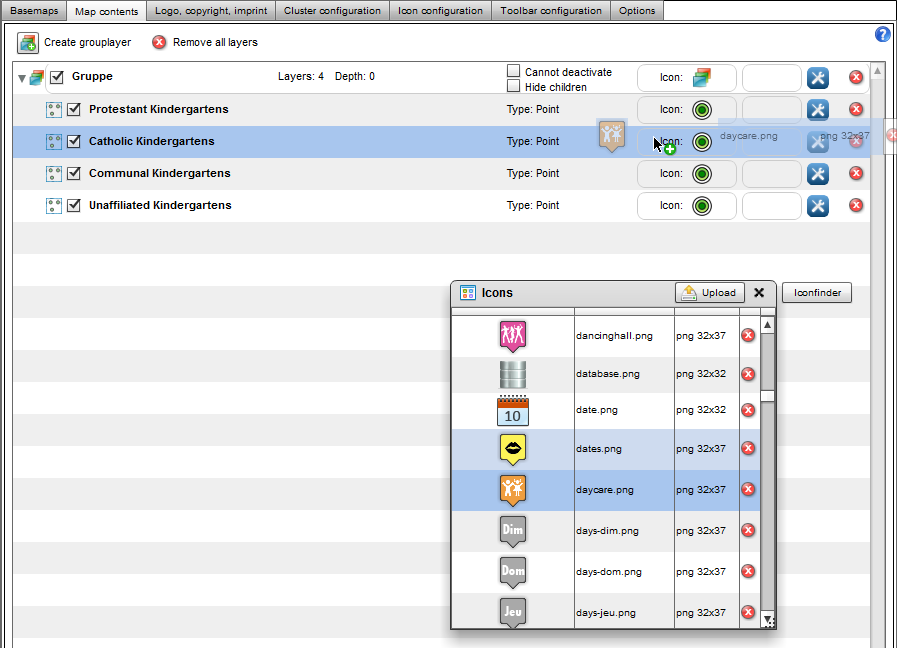
Then, you assign each layer its own icon by dragging the icon on the respective layer.
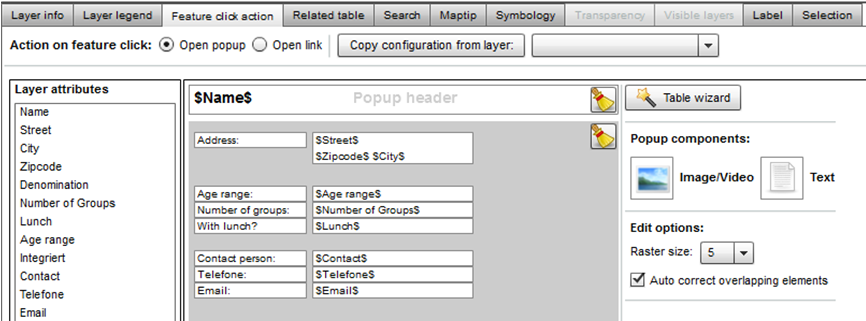
After that, you edit the pop-up window of the layers. In order to check your input, click on the button "preview" in the bottom right corner of the pop up configuration. If you have configured the pop-up of a layer, the configuration can be also be used for the other layers by clicking  . This way, all layers are configured in the same way.
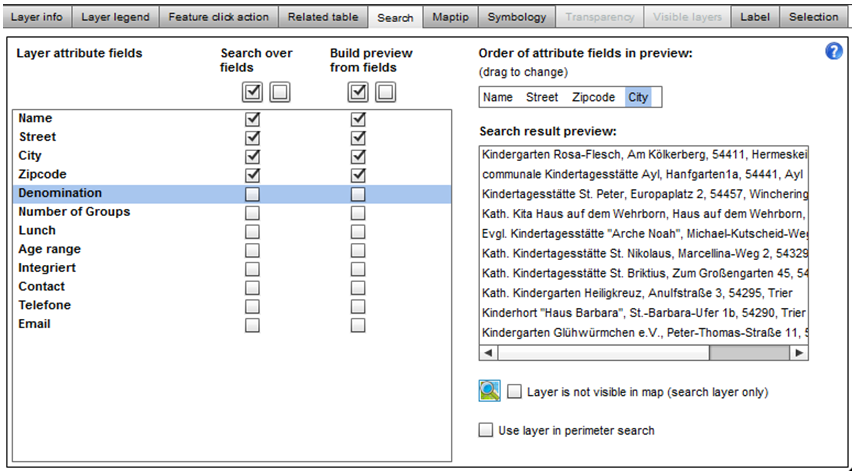
Next, the search functionality of the layer is edited.
For the configuration of the maptips, the attribute "Name" is automatically selected and doesn't have to be changed. Since the layer is supposed to be displayed with the chosen icons, the symbology doesn't have to be changed either.
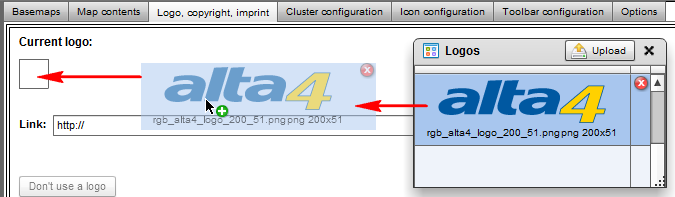
Logo, Copyright and Imprint
Now you edit the logo, copyright and imprint. You chose the logo from the logos toolbar and pull the logo into the "current logo" box. If you would like to adjust the position of the logo in the map application, you could start the preview and drag the logo to the the right spot.
Now you can set up a link that is opened when clicking on the logo. In addition, you configure the copyright text and the imprint.
In the tab cluster, you can now chose up to which scale range the icons should be clustered and which size the cluster icons should have. For this map the cluster maximal scale 1:9.244.649 and the cluster icon size 37 should be good settings.
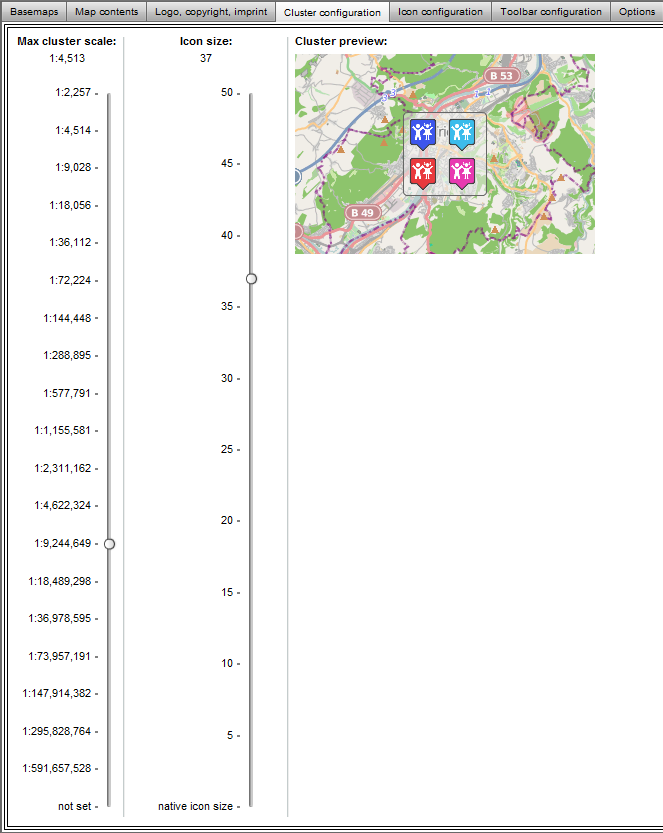
Since your scale range is very limited, a separate setting for the scale-dependent icon size is not necessary.
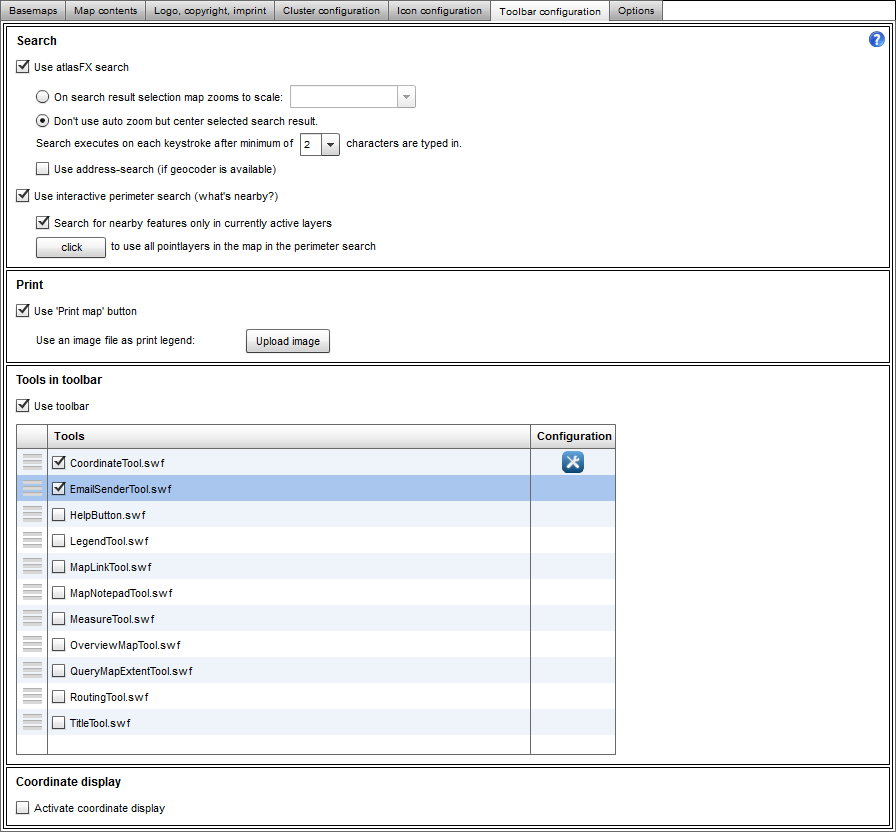
Inside the tab "tools", you activate the atlasFX search, print map button, the CoordinateTool and the EmailSenderTool.
With the search function activated, the map user can now search for kindergartens over the attributes that you selected under the advanced options of the layers. The map user can also print the current map extent with a print button and send the map extent to friend via email. With the coordinate tool, he can also check the coordinates of the mouse pointer.
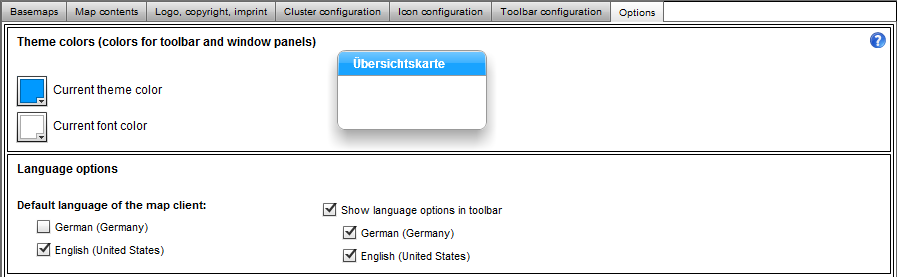
As a final step, the options of the map are set. For this example map, you change the background color to blue and the starting language to English.
Finally, you can check your map with the map preview.