|
|
Symbology |
|
|
|
|
Symbology |
|
|
Depending on the data type, you have different options to style your data.
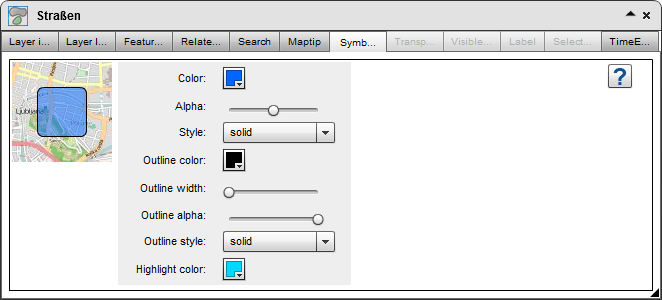
If you use polygons (planar vector data), you can configure it as followed:
You have the ability to edit the fill color and transparency, as well as their style. You can also change color, width, transparency and the style of the outline. The display on the left side shows an example representation of the polygon configuration.
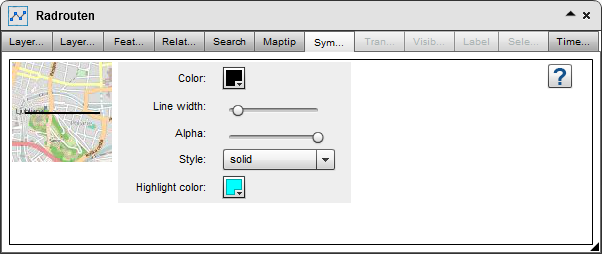
The appearance of linear data is set in the same way.
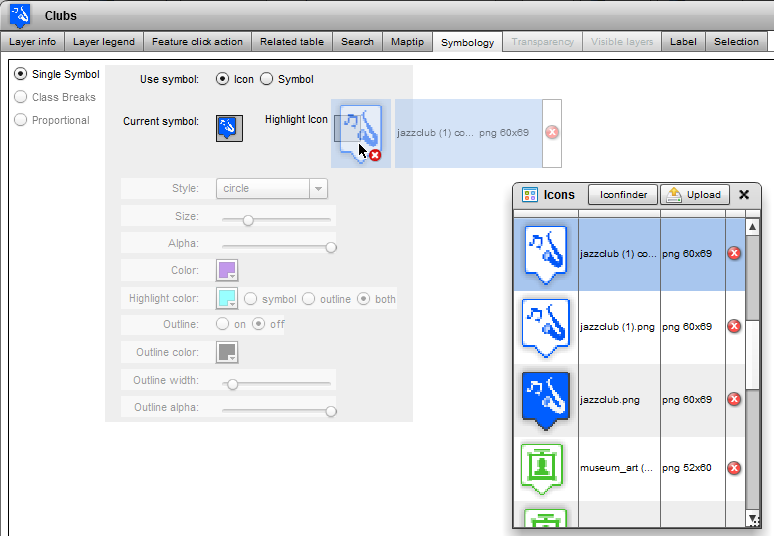
Point data can be individualized according to a similar pattern.
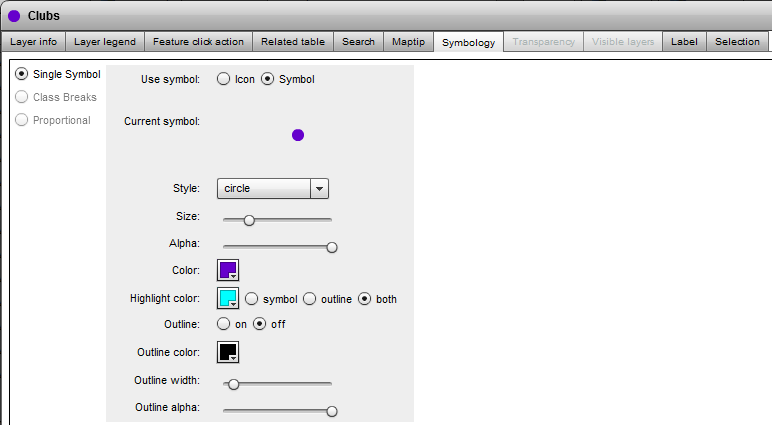
The feature "Class Breaks" and "Proportional" will be implemented in future versions and not available in the current version.
Therefore the feature is greyed out.
Alternative you can use Icons to display point features. If you use them you can define special highlight icons for your symbols which will be displayed by hovering and clicking on features within the map.
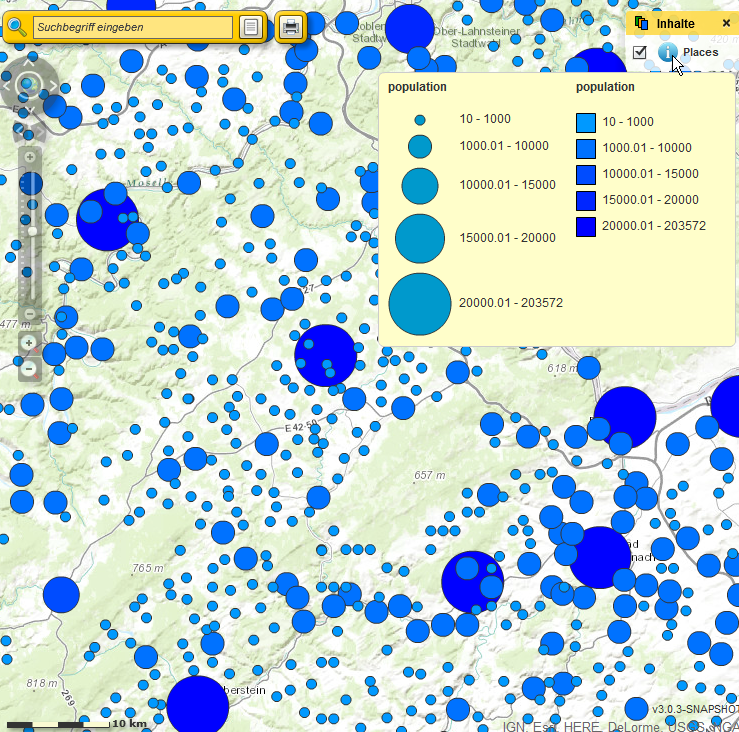
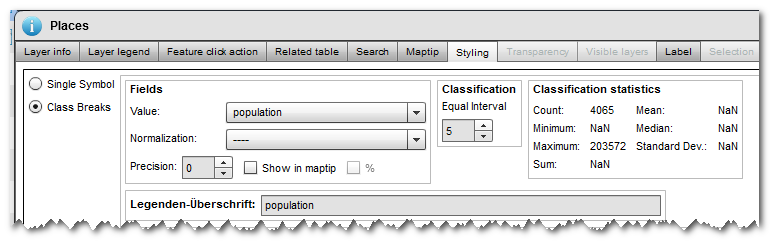
In version 3.0.3 classified representation for point data available in the beta version.
With this feature you can use a classification based symbology considering the size of the attribute values. This presentation is ideal for illustrating differences in size. It can be use to classify both the size of the point symbols and the color of the point symbols based on self-definable fields.
In the beta phase, the classes can not be determined automatically. First, set the number field on which the classification is based and define the number of intervals.
With "Precision" you define the precision of the intervals (decimal places). If you select the option "Show In MapTip" the appropriate class value will be displayed when hovering over the point feature in the map.
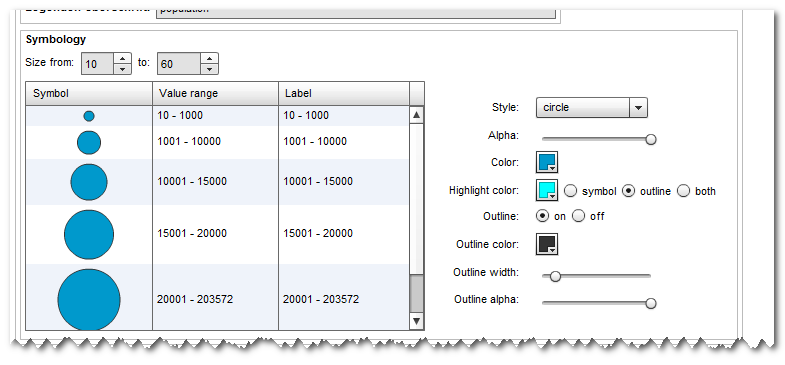
Select the minimum and maximum size of the point symbol and set the value ranges (from-to) manually.
Set the appearance of the point symbols as known.
You can visualize the size differences as well in color. Make the settings according to the size settings before. The value field can be the same as defined in the icon size settings. But you can also change it to any other number field.
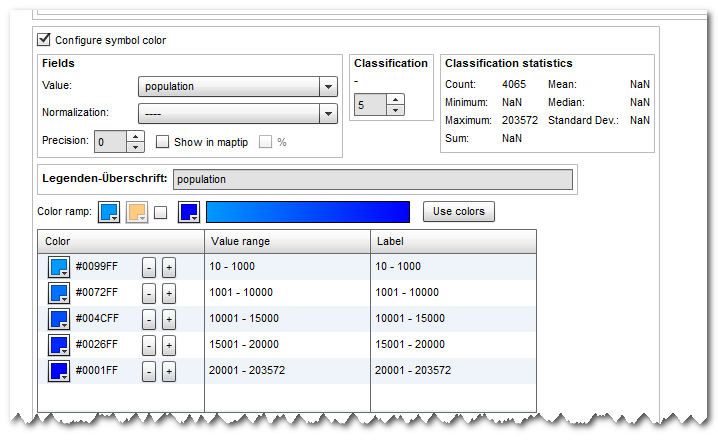
In the map, the class information is explained in the layer's legend: