On this index tab, the various support elements of the map can be configured, as for instance an information bar, an outline map or the legend. Besides, there are rich options for setting colors and fonts and the possibility of defining size and position of the map in the browser.
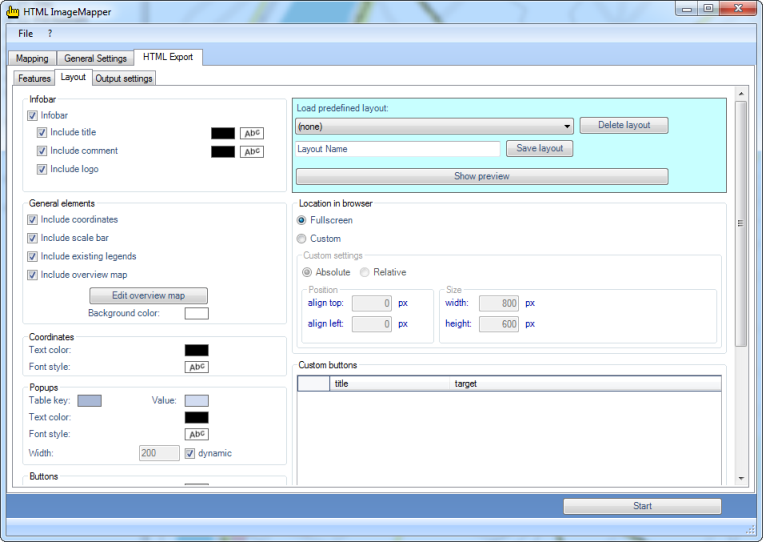
Information bar
With this option, a heading and, where required, a logo are displayed at the upper edge of the map.
In order to activate this option, you must click on “Infobar” in the checkbox and enable “Include Title” and “Include Commentary”, if necessary.
You can adjust the color by clicking on the (by default) black rectangle and the font via “Abc”.
If a logo shall be integrated, the checkbox “Include Logo” has to be activated. This opens a dialog window where the picture can be selected. (Possible formats are .jpg, .gif and .png)
The scroll bar “Infobar Transparence" varies the opacity of the information bar with the exception of the logo.
General elements
Overview map
If you wish to have an overview map, you have to click on the corresponding checkbox in the frame "General elements" (on the "Layout" index tab). With this, a dialog opens where the options of the overview map can be set.
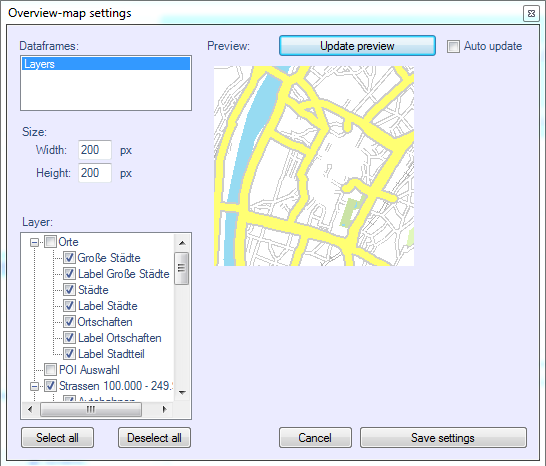
If you have several themes activated, you can set the overview map parameters for each theme separately after selecting it from “data frames”.
The size of the overview map can be adapted with the entry boxes “Width” and “Height”. The width-to-height ratio is kept up automatically.
In the list “Layer” you can select the levels to be displayed in the outline map. If there are many layers, it is often easier to deactivate all checkboxes and then select the few which are actually appropriate in such a small scale.
Finally, you can bring the preview up-to-date via “Update preview”. The settings can be saved and reloaded in other projects via the settings file.
User defined buttons
Here you can create hyperlinks to any website you wish. These hyperlinks are displayed as buttons in the lower bar of the map.
Click on “add button” an then on the marked space below “title” to enter one. Then click on the “target”-column in the same line to mark it. Another click allows you to enter the URL.
In order to delete a button, the corresponding line has to be selected. You can do this by clicking on the small grey space on the left in the line which you want to delete. After that, press “remove button”.
Colors and fonts
You can check the effects of your settings anytime by clicking “Display preview”.
Hint: The preview display only changes in color and font. All other settings are ignored.
In order to give an individual layout to your map, you can define by yourself the settings concerning colors and fonts to a large extent. (To set a color, click on the corresponding monochrome rectangles. A dialog will open.)
In the box
Managing layouts
HTML ImageMapper 13.3 allows you to save layouts in order to be able to reload them for further use. These layouts contain the color and font definitions.
The box “Load predefined layout” contains the ones you have created yourself in addition to the originally provided standard layouts.
In order to save the active layout, first enter the name into the entry box with the default setting “Layout name” and then click on “Save layout”.
With “Delete layout” you can delete layout definitions which are no longer needed.
Position in the browser
In the box “Position in the browser” you can set up the map’s size in the browser. Besides the option "Full screen" you can also limit the size pixel-accurately with "User defined". In order to do this, the corresponding values are to be typed into the adjoining entry boxes.
You can either specify the “absolute” values (i.e. in pixels) or select “relative” where the map size is set as a percentage of the browser window size. After that, the numeric values have to be entered into the entry fields grouped under “Position” and “Size”.