IdentifyAndSelectionTool
Note: The IdentifyAndSelection Tool is not available in atlasFX 3.0+
With the IdentifyAndSelection tool you have the possibility to identify features in the JavaScript client and let create reports about the features.
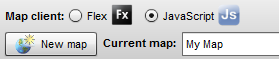
The tool is used exclusively in the JavaScript client. Before the tool can be configured the map client must be set to a JavaScript.
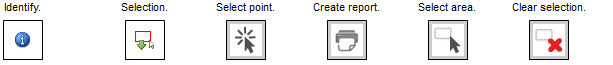
Thereafter the tool can be configured in the CMS under the tab "Tool configuration". In the upper part you can see six buttons with a description of the functions.
These can be replaced by drag&drop icons from the Icon window.
At the bottom of the tool configuration you see the default template, which is used for the reports. You can change the HTML template if necessary. Within the range of the actual report <body> container shall be inserted:
<div id="atlasReportDiv"> </div>
If the IdentifyAndSelectionTool is activated, the tools in the JavaScript client are active. The settings of the tab "selection" in the Layer Properties are considered.

Note: The IdentifyAndSelection Tool just can be used with data from ArcGIS Server services and can't be used with AtlasPoints which are generated from external databases or were generated by Excel upload.
Functions of the identify tool in the map
The identify tool  displays attribute information to the single layers on a separate page. It stays active until it will be deactivated or another tool is used. The display of the attributes is dependend of the configurations taken within the tab "selection" of the layer properties. In the report you'll also find features which are not activated in the table of contents. The entries listed in the report are clickable. This will open the map by displaying the corresponding objects.
Functions of the selection tools in the map
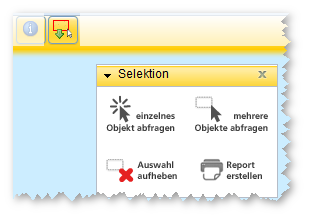
In the JavaScript map the selection tools are available after clicking on the button  .
.
Method:
-
Select single or multiple objects by clicking on one of the following buttons:
 Multiple objects can also be selected sequentially. By clicking on the button
  the selection of the objects is deleted.
Note: The selection tools are not applicable to point data in a cluster. They can be used only in not clustered state. Otherwise, no point data is selected. -
After the objects have been selected on the map, you create the report using the button

In the report you'll also find features which are not activated in the table of contents. The entries listed in the report are clickable. This will open the map by displaying the corresponding objects.