Unique Value
Beside the visualization of point data (all features in a layer) as a single symbol or icon, features can be visualized on the basis of a distinct field value. The attribute field must have the data type string or integer.

After the selection of the respective symbology type, the attribute field has to be chosen. The categoric visualization is suitable for fields containing classes, types or conditions of features. The distinct attribute value of this field (e. g. land use XY) determines the symbology of the point features.
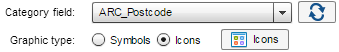
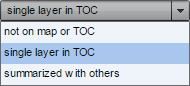
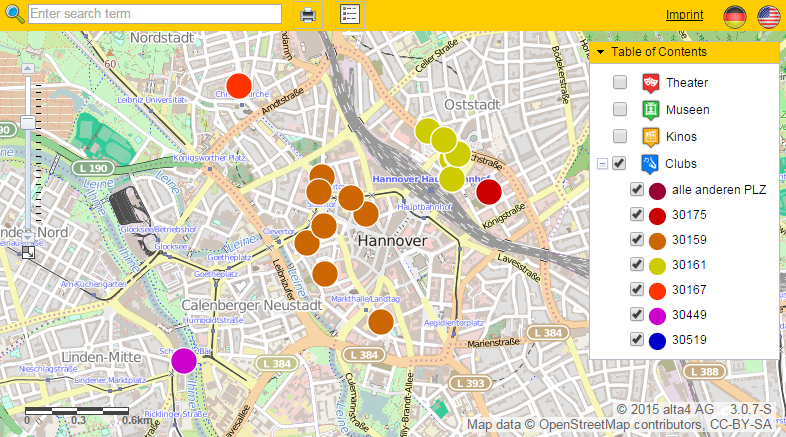
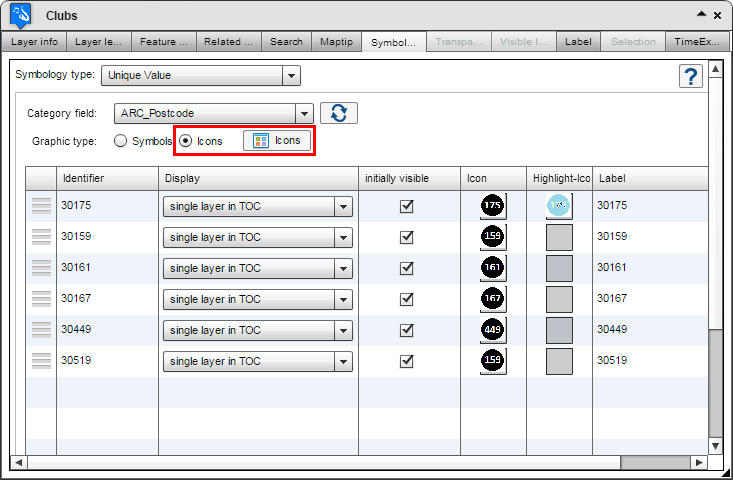
In the example presented here, the point features should be colored based on the ZIP code. If multiple point objects are located in the same postcode area, they will be drawn with the same symbology. The ZIP codes are stored in the field ARC_Postcode in the attribute table. After selecting the column, atlasFX ads every unique attribute value as a category to the table. With the dropdown in the column "Label" you can determine then, that the categories should appear as a single layer with a separate symbology in the legend and in the map. Alternatively, you can define that a category appears neither in the map nor in the legend or that a category is listed beyond the category for other values.
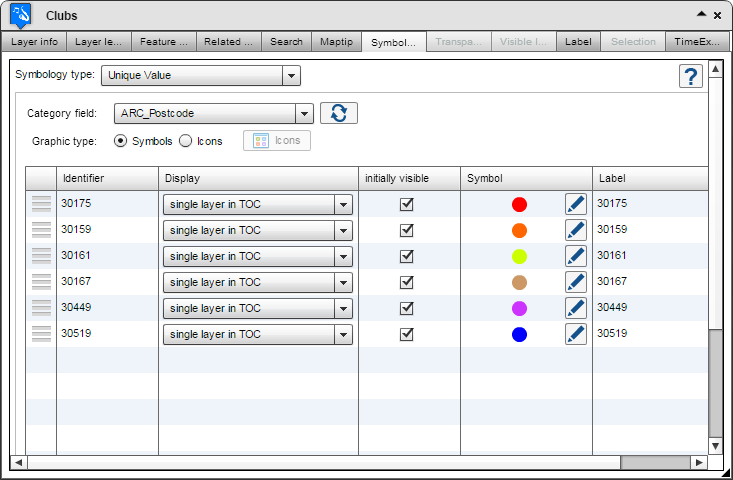
Now the order in the map and the legend  , the initial visibility in the map
  /
/  , the TOC label and the map symbol
  can be adjusted for each category in the table.
By clicking  the data source will be reloaded. As a consequence, all values of the selected attribute field will be read. Thus, values which have been added since the last configuration are added to the table. Accordingly, categories are deleted when the respective identifier cannot be found in the selected field.
If you do not update the data source manually although the data source has changed, categories which haven't been recognized ("new") yet are grouped under the default category and drawn corresponding to the default symbol. If a particular category is no longer represented in the modified data source, the category's geometries are of course no longer drawn in the map while its items remain in the TOC until the next manual update.
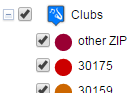
Activate the checkbox  to group the unique categories under the layer name in a drop-down menu (pseudo layer). With the checkbox
  it can defined, that the drop-down menu is opened by default. The label of the category group can be edited in the free text field below the table.
A deactivated group layer option will display the categories as pseudo layers at the highest hierarchy level of the TOC:
Note: The layer legend will only be displayed for unique value layers, if the group layer option is enabled. Otherwise, the layer legend is not taken into consideration.
If the contents of the data source change and values (which were not known during the category configuration) are added, atlasFX treats them as other values. In the lower section the presentation of other values is configured. You can select, if those point features should be displayed in the map and the legend at all. Furthermore, the initial visibility, the legend label and the default icon can be adjusted.

A possible symbol configuration which considers a categorization of the points by their postal code might look like this:
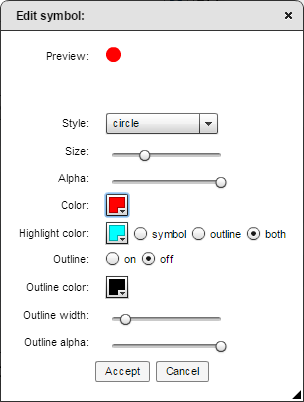
In addition to the symbol configuration, the display type "Icons" can be chosen. After selecting the respective radio button, click  to access the icon browser. Via drag n drop, you can now put your favorite graphic into a grey rectangle to define a category icon. The highlight icons can be set for each category, too.
Possible application scenarios for the symbology type "Unique Value" can be looked up in this chapter.