The way from ArcGIS to the Internet
Step 1:
After the successful installation you load or create your map in ArcGIS as usual. Now you start the “HTML ImageMapper 14.5” extension by clicking the yellow hand (A). If you cannot find the hand icon, follow the instructions in chapter “Loading in ArcMap”.
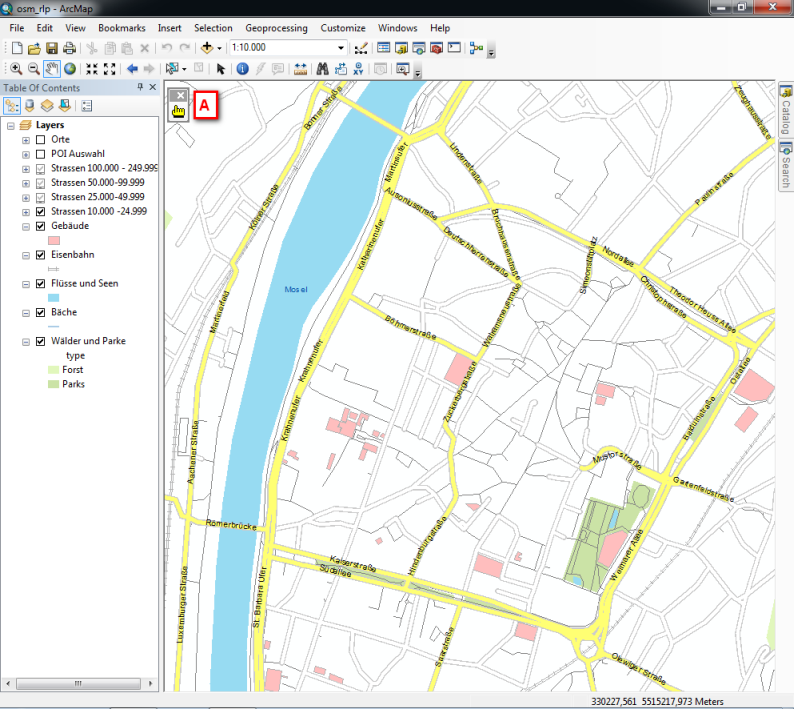
HINT: You can click the “Start" button to create an HTML ImageMapper project at any time, this means even at once. After a short holding time the result is presented in the browser according to your wish.
Step 2:
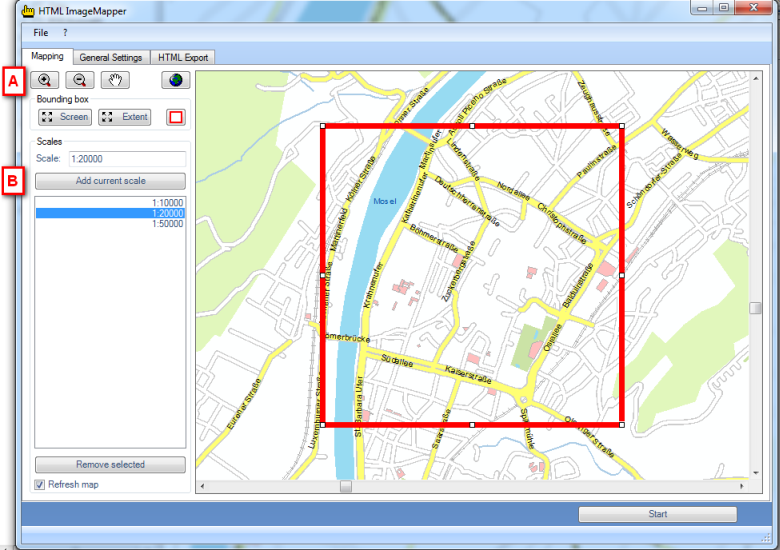
The current map extent is displayed by default. In order to change this, click on the magnifier to zoom in (A) and pull open a box in the preview map. If you are pleased with the new scale, you can accept it with "Add current scale" (B) (or continue adapting it with the two magnifying glass functions). You can later zoom in the online map between the set up scales.
Step 3:
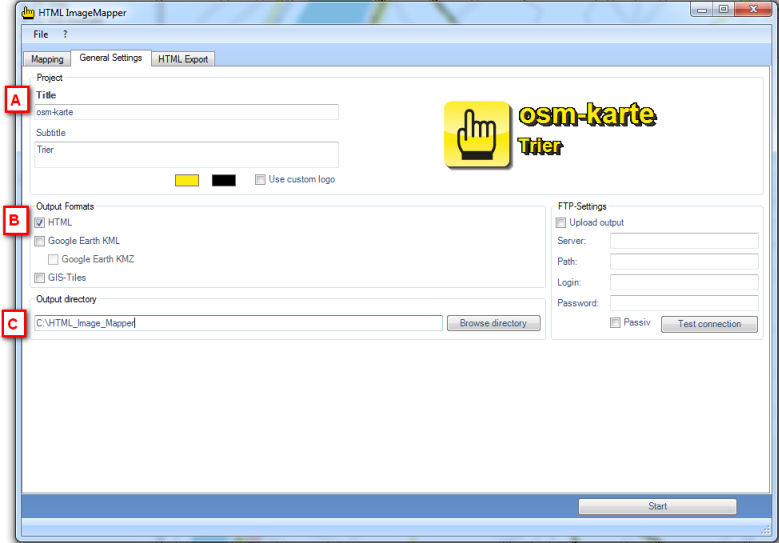
The General Settings are next. Enter the map title and if required the subtitle (A). Choose HTML as the output format (B). In the last step you just have to specify where you want to save your project (C).
Step 4:
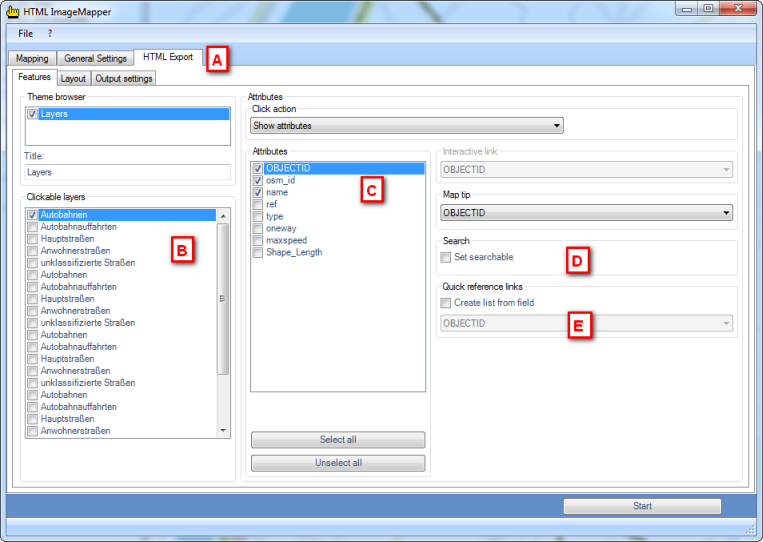
Continue by clicking the Features tab on the HTML Export tab (A). Here you will assign an action to layers and their objects respectively, which is carried out by clicking them. First select from "Clickable layers" (B) the one you wish. Leave the click-function on “Show attributes” and choose under “Attributes” (C) the ones to be displayed when clicking on the object. If you select "Set searchable” (D), your online map can be searched for attributes of the chosen layer. Additionally you can have a link list created (E) from which you can later choose your desired feature
Step 5:
Continue with "Layout” (A).
Activate "Infobar” (B) and “Include title” (C) in order to entitle your map. To add more elements to the map, click "Include coordinates" (D) as well as “include scale bar” (E) to show them.
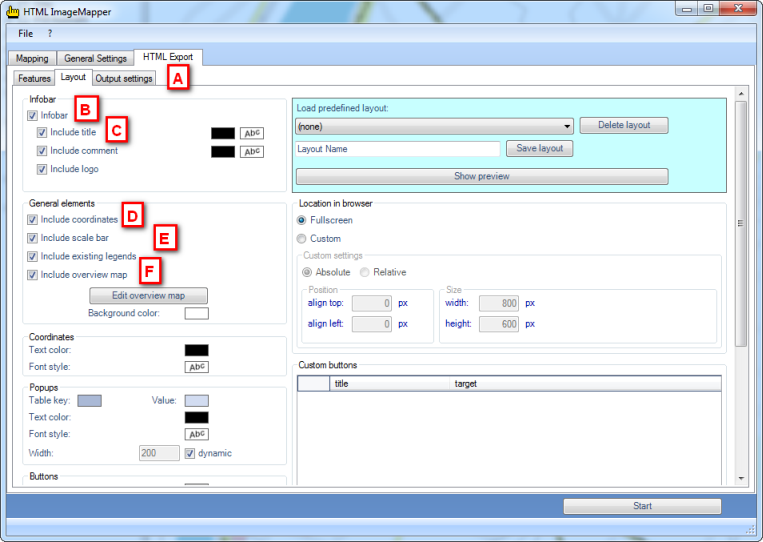
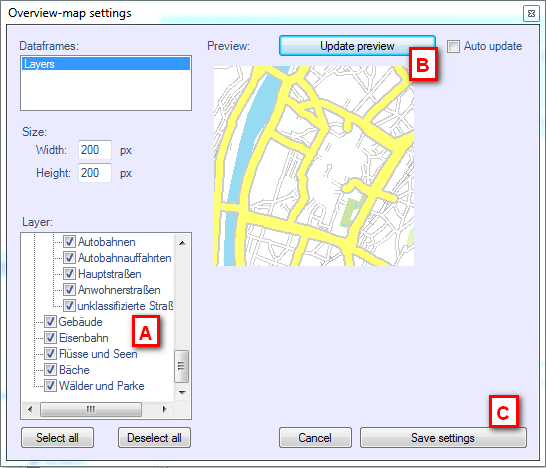
An outline map can be created by clicking "Include overview map”(F). A dialog window will open.
Choose the layers you want to use for the overview map (A). Click on “refresh preview” (B) to take a look at the result. If your are satisfied with the result you can confirm and click on “save settings” (C).
We leave the manifold settings for the appearance of the map on the default settings.
Step 6:
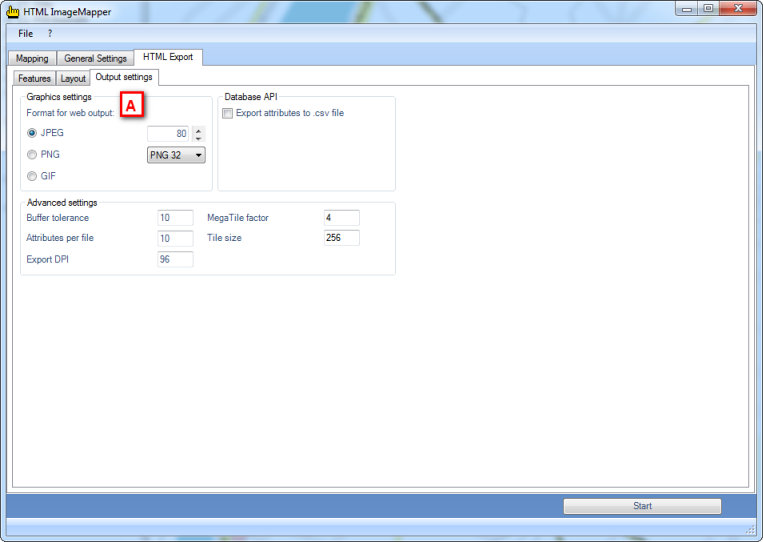
In the tab „output“ you can choose the format of the output tiles if required (A). At first do not change the default settings.
Click on “Start” (B) and the request after processing in your browser.
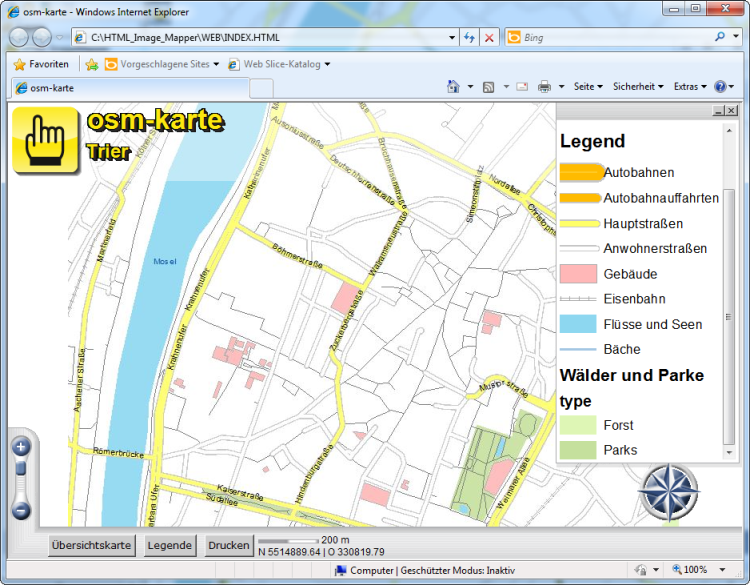
You can then marvel at the result of the few efforts you went through:
