Heatmaps
Beside the already presented representation types of point data, you can derive density maps, which are also known as heat maps. On Microsoft Internet Explorer, heatmaps are fully supported from version 10 and newer.
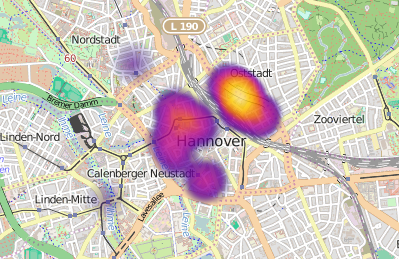
Here, the quantitative value characteristics of a user-defined attribute field become color-coded. The selected attribute field must be of a numeric data type, the attribute values may not be negative.
For a single feature a disk with a radial gradient is drawn. The greater the distance to the point, the smaller is the influence of it and eventually the more inferior is its color (color in the left part of the spectrum).

Several points located in a close distance to each other thus have a greater impact and can fuse at their intersections. This also means, that the symbology aggregates in a smaller scale (higher scale denominator) since the points are close together. Therefore the map display is scale-depended.

If the field value is high in comparison to the values of the other features in the visible map extent, the center of the point is then drawn in a color of the right part of the spectrum. Thus the map display depends on the values of the visible points.
Flex-Client
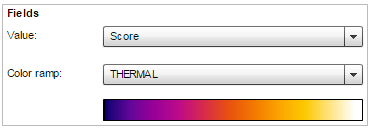
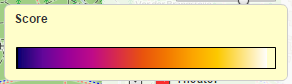
To symbolize a heatmap, a spectrum can be chosen from three different multi-polar gradients. Like in the class breaks configuration a title can be defined which will appear in the legend while hovering the legend item of the heatmap layer. By default, this is the selected field name:
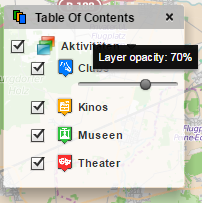
The opacity of the heatmap elements can also be controlled by the user of the map. atlasFX provides a slider in the table of contents for this purpose:
JavaScript-Client
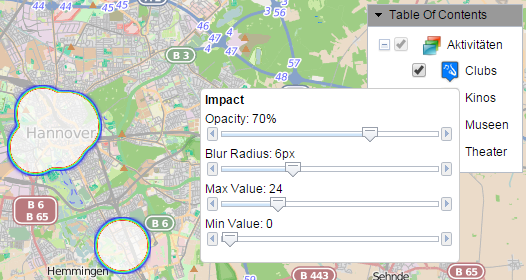
Three different gradients are available in the JavaScript-Client, too. By hovering or clicking on the heatmap layer, the heatmap-parameters opacity, blur radius, maximum value and minimum value can be customized. The heatmap title is shown on top of the heatmap legend.
Possible application scenarios for the symbology type "Heatmaps" can be looked up in this chapter.