Class Breaks
Since version 3.0.3 classified representation for point data is available in the beta version. This allows you to differentiate point features with their icon size. The size depends on the value of the selected attribute field. This representation is ideal for illustrating differences in size. Beside the classification by size, a second classification can be added by visualizing different colors based on values of a self-defined field. The selected attribute field must be of a numeric data type.
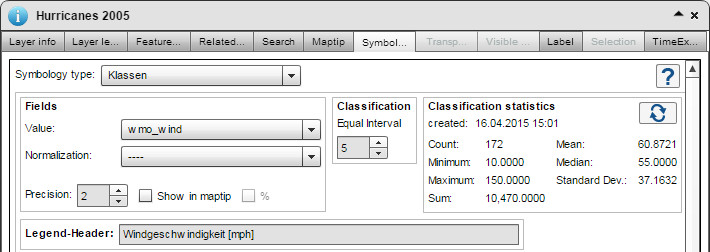
Classes can be determined automatically or by modifying them manually. For the calculation of the statistic values just the first 20.000 values will be included. Larger datasets may lead into some differences to the calculations over the complete dataset. Manual changes with values less than the calculated minimum or higher than the calculated maximum are always possible.
You can recreate the statistics by pushing the refresh button  .
.
Set the number field on which the classification is based and define the number of intervals.
With "Precision" you define the precision of the intervals (decimal places). If you select the option "Show In maptip" the appropriate class value will be displayed when hovering over the point feature in the map.
You can define a headline for the classification which will show up in the classification legend. By default, the attribute field's name is used.
After that, select the minimum and maximum size of the point symbol. You can set the value ranges (from-to) manually as well. The values will be refreshed automatically each time you change the classification interval. By clicking  the previously defined value range will be applied for the respective label of a class. Point features not participating in any class are summarized under the default class and drawn in the map according to the configuration. The appearance of the point symbols for the classes is customized as usual.
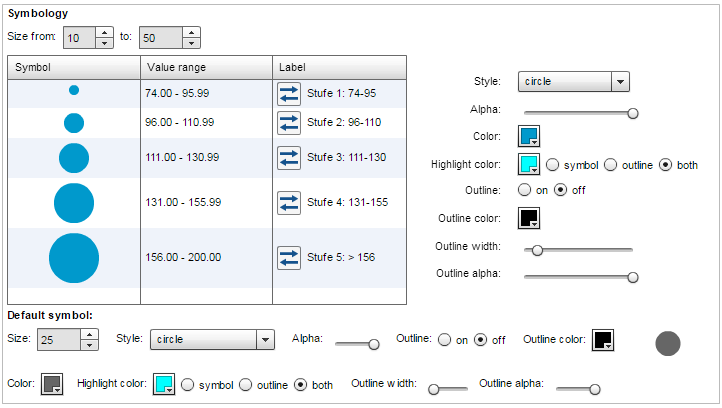
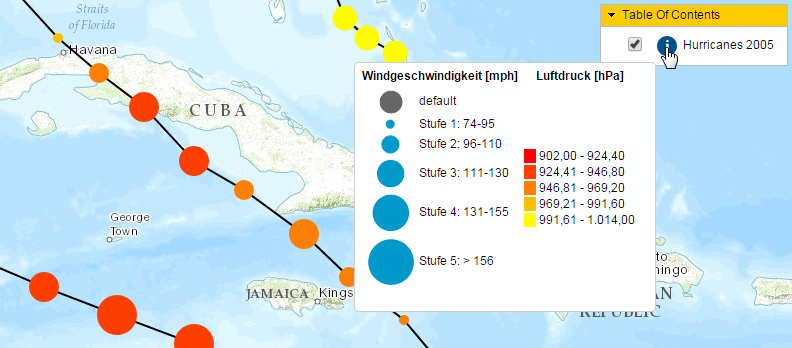
Beside the classification by size you can make a classification with the symbol color to visualize the values of a second attribute field. As a result, even more information can be transferred in a single symbol.

In the map, the class information is explained in the layer's legend:
Possible application scenarios for the symbology type "Class Breaks" can be looked up in this chapter.